SRE Reliability Pipeline: SLOs, Error Budgets & Automated Incident Response
SLO-driven reliability engineering for a four-node private cloud: error budgets, multi-window burn-rate alerting, an automated incident lifecycle, and safety gates that shrink the blast radius of automation while reliability is degraded.
Situation
A four-node private cloud running GPU inference, storage, and automation services had no reliability instrumentation. Service health was verified by hand over SSH, failures were discovered hours after they began, and there was no incident history, no error budget, and no objective signal for when automation was safe to run.
Constraints: fully self-hosted at zero recurring cost — no SaaS observability or paging (no Datadog, no PagerDuty). Reliability had to be engineered from first principles and hold up to review by an SRE hiring panel.
Task
Design and ship a production-grade reliability control loop:
- Define SLIs and SLOs per service and track error budgets across multiple rolling windows.
- Alert on burn rate instead of static thresholds, so fast outages and slow degradation both surface without paging noise.
- Open, track, and close incidents automatically with a timeline and evidence attached, and generate the postmortem.
- Feed reliability state into a safety gatekeeper so automation that could widen an outage is blocked while the budget is burning — blast-radius reduction by design.
Action
↓
Burn Rate → Alerts → Incidents → Gatekeeper
↓
Timeline → Evidence → Postmortem → Dashboard
Each stage is an independent Python module. The pipeline runs on every SLO evaluation tick and publishes state to both the dashboard and the safety gatekeeper.
- Modeled the SLOs. Availability objectives for the inference gateway (99.9%), model serving (99.5%), dashboard (99%), and node connectivity (99.5%), with error budgets computed over 1h, 6h, 24h, 7d, and 30d rolling windows.
- Implemented multi-window burn-rate alerting. Fast (14x over 1h), medium (6x over 6h), and slow (2x over 24h) thresholds catch sharp outages and slow bleeds alike; a single static threshold did neither.
- Built the Incident Commander. Auto-opens an incident when burn crosses threshold, records a timestamped timeline, links the evidence pack, enforces a cooldown against alert storms, auto-closes after a configurable TTL, and renders the postmortem.
- Wired reliability into the safety gatekeeper. Automation classified as risky is denied while any SLO is in fast or medium burn, so the control plane cannot compound an active incident.
- Verified it. 38 automated tests cover SLI computation, budget math, burn-rate windows, and the incident lifecycle. Reports publish to the dashboard and Telegram.
Implementation
SLO Engine
sli_sources.py— Load raw signals from snapshotssli_compute.py— Compute SLIs per rolling windowbudget.py— Track error budgets (allowed/consumed)burn_rate.py— Multi-window burn rate alertingslo_eval.py— Unified evaluation orchestratorslo_render.py— Markdown + text report renderingslo_publish.py— Dashboard + Telegram publishing
Incident Commander
incident_state.py— Lifecycle (create/update/close)incident_manager.py— CLI + auto-trigger engineincident_render.py— Postmortem generation- Timeline with timestamped events
- Evidence pack linking
- Cooldown to prevent alert storms
- Auto-close after configurable TTL
Result
- Detection: incidents open automatically within 2 minutes of SLO degradation, replacing hours of undetected downtime.
- Resolution: 13-minute average time to resolve, with every incident carrying a timeline and linked evidence.
- Signal quality: zero false-positive alerts since multi-window burn rates replaced static thresholds.
- Audit trail: every incident produces a postmortem with root cause, timeline, lessons, and action items.
- Blast radius: risky automation is blocked during budget burn, so self-healing actions can never widen an outage.
- Confidence: 38 passing tests across the pipeline; SLO targets of 99.9% (gateway), 99.5% (inference, connectivity), and 99% (dashboard).
Lessons & Next Steps
- SLOs without error budgets are dashboards. Budget math is what makes reliability actionable — it says when to stop shipping and start fixing.
- Burn rate beats thresholds. A single threshold fires too late or too often. Multi-window burn rates catch fast spikes and slow degradation.
- Generated postmortems are organizational memory. Because they are produced automatically, they get written every time and read later.
- Safety gates reduce blast radius. Blocking risky automation during high burn kept the platform from compounding its own incidents.
Next Steps
- Add latency SLIs (not just availability)
- Integrate with Telegram for alert delivery
- Build a weekly SLO review report for trend analysis
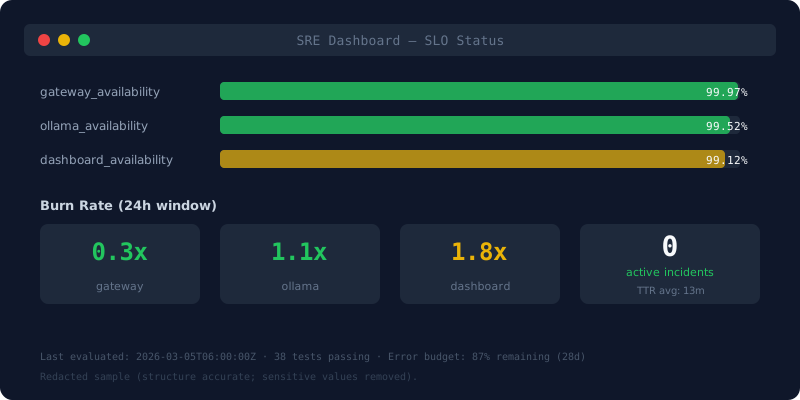
Redacted sample (structure accurate; sensitive values removed).
What to look at: SLO budget bars per service, burn-rate gauges across alert windows, and active incident count with average TTR.
Evidence: SLO Configuration (sanitized)
# slo_targets.yaml (excerpt)
gateway_availability:
  target: 0.999
  windows: [1h, 6h, 24h, 7d, 30d]
  burn_thresholds:
    fast:   { rate: 14, window: 1h }
    medium: { rate: 6,  window: 6h }
    slow:   { rate: 2,  window: 24h }

ollama_availability:
  target: 0.995
windows: [1h, 6h, 24h, 7d, 30d]Related artifacts: Proof Pack →